Financial Information
Financial Transparency
We encourage our community to take an active role in government; knowing how your tax dollars are used helps you make informed decisions as voters and citizens. With this in mind, our goal is to share financial information in a user-friendly and understandable format.
The Texas Comptroller’s Transparency Star Program recognizes local government entities that provide easy online access to important financial data. Richardson ISD received a star in the area of Traditional Finances, which recognizes entities for their outstanding efforts in making their spending and revenue information available.
Revenues and expenditures for most recently completed fiscal year
Summary of revenues and expenditures and related impact on fund balance for the 2024-25 fiscal year
| Item | General Fund Total | General Fund Amount per Student | All Other Funds | All Other Funds Amount per Student* | Total | Total Per Student |
|---|---|---|---|---|---|---|
| Fund Balance July 1 (Beginning) | $183,514,011 | $4,964 | $183,912,676 | $4,974 | $367,426,687 | $9,938 |
| Property Tax Revenue** | $242,247,191 | $6,552 | $109,748,641 | $2,969 | $351,995,832 | $9,521 |
| Other Local Revenue | $19,942,254 | $539 | $21,914,234 | $593 | $41,856,487 | $1,132 |
| State program revenues | $143,272,130 | $3,875 | $17,924,882 | $485 | $161,197,012 | $4,360 |
| Federal program revenues | $8,817,843 | $239 | $44,025,066 | $1,190 | $52,842,909 | $1,429 |
| Total Revenue*** | $414,279,418 | $16,169 | $193,612,822 | $273 | $607,892,240 | $16,442 |
| Total Expenditures | $430,319,383 | $11,639 | $292,094,536 | $7,901 | $722,413,919 | $19,540 |
| Excess (Deficiency) of Revenues Over (Under) Expenditures | $(16,039,965) | $(434) | $(98,481,714) | $(2,664) | $(114,521,679) | $(3,098) |
| Total other financing sources (Uses) | $(953,362) | $(26) | $144,737,711 | $3,915 | $143,784,349 | $3,889 |
| Net change in fund balance | $(16,993,327) | $(460) | $46,255,997 | $1,252 | $29,262,670 | $792 |
| Fund Balance June 30 (Ending) | $166,520,684 | $4,504 | $230,168,673 | $6,226 | $396,689,357 | $10,730 |
**Property Tax Revenue includes interest, penalties, and other tax revenue.
***The District does not collect revenue from sales tax.
Staffing for most recently completed fiscal year
Student and Full-Time Equivalent (FTE) staffing counts for 2024-25.
| Fiscal Year | Students | Teaching FTE | Other FTE | Total FTE |
|---|---|---|---|---|
| 2024-25 | 36,971 | 2,657.9 | 2,839.3 | 5,497.2 |
Financial data trends over a five-year period
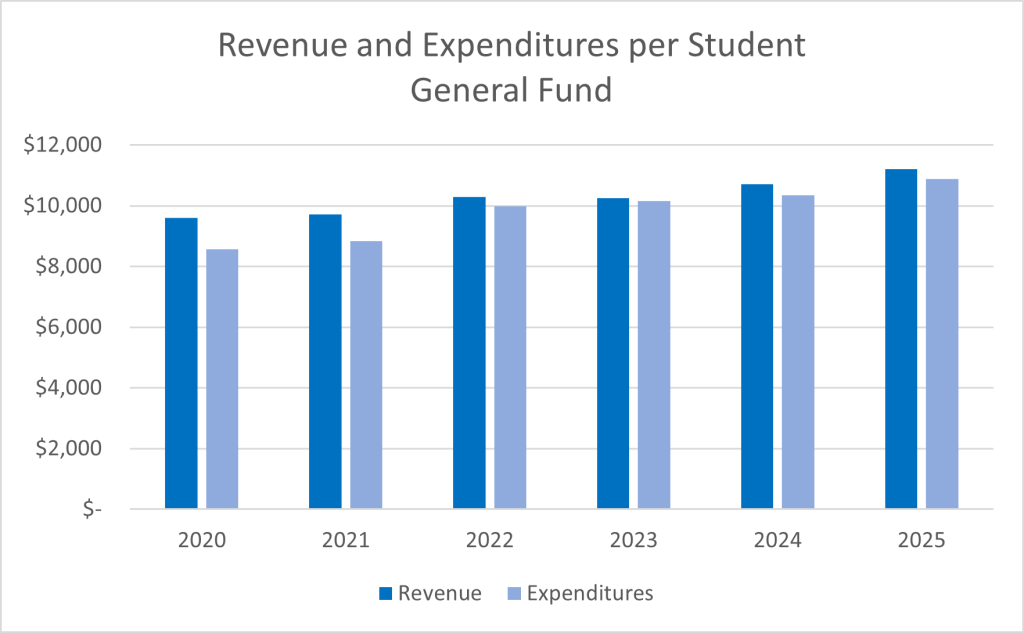
| School Year | Revenue | Expenditures |
|---|---|---|
| 2019-20 | $ 13,484.77 | $ 15,200.07 |
| 2020-21 | $ 13,865.89 | $ 14,989.30 |
| 2021-22 | $ 14,790.10 | $ 18,994.23 |
| 2022-23 | $ 16,236.12 | $ 22,045.97 |
| 2023-24 | $ 16,656.52 | $ 20,619.07 |
| 2024-25 | $ 16,442.41 | $ 19,540.02 |
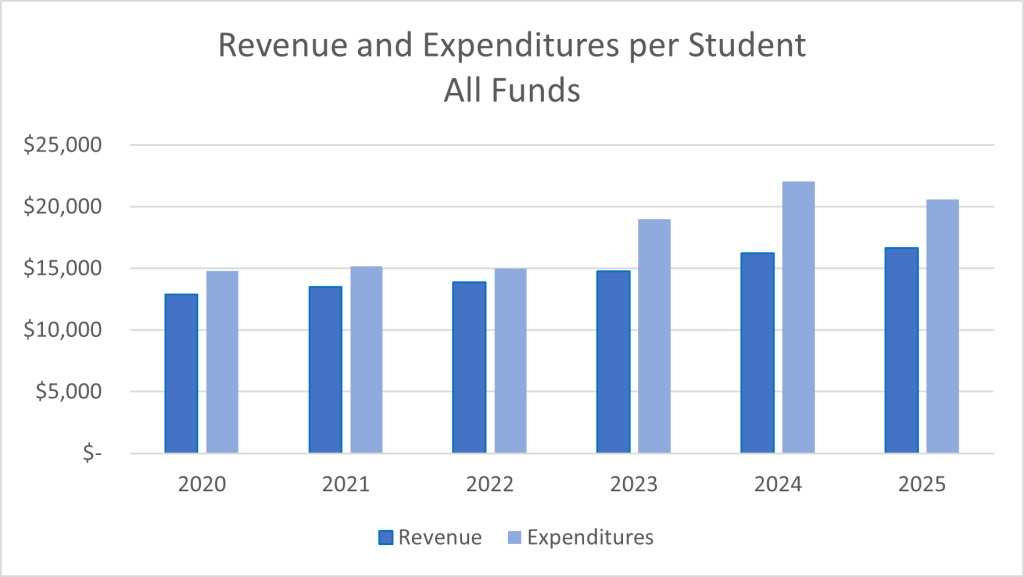
| School Year | Revenue | Expenditures |
|---|---|---|
| 2019-20 | $13,484.77 | $15,200.07 |
| 2020-21 | $13,865.89 | $14,989.30 |
| 2021-22 | $14,790.10 | $18,994.23 |
| 2022-23 | $16,236.12 | $22,045.97 |
| 2023-24 | $16,656.52 | $20,619.07 |
| 2024-25 | $16,442.41 | $19,540.02 |
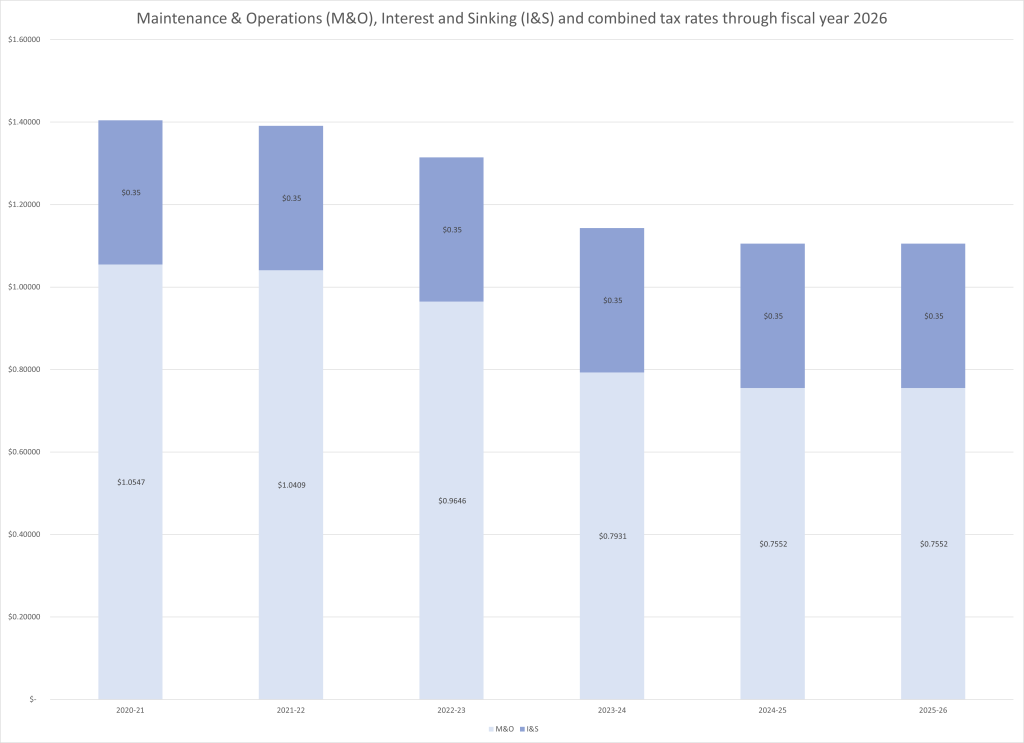
| School Year | M&O | I&S | Combined |
|---|---|---|---|
| 2014-15 | $ 1.04005 | $ 0.30 | 1.34005 |
| 2015-16 | $ 1.04005 | $ 0.30 | 1.34005 |
| 2016-17 | $ 1.04005 | $ 0.30 | 1.34005 |
| 2017-18 | $ 1.04005 | $ 0.35 | 1.39005 |
| 2019-20 | $ 1.06835 | $ 0.35 | $ 1.41835 |
| 2020-21 | $ 1.0547 | $ 0.35 | $ 1.40470 |
| 2021-22 | $ 1.0409 | $ 0.35 | $ 1.39090 |
| 2022-23 | $ 0.9646 | $ 0.35 | $ 1.31460 |
| 2023-24 | $ 0.7931 | $ 0.35 | $ 1.14310 |
| 2024-25 | $ 0.7552 | $ 0.35 | $ 1.10520 |
| 2025-26 | $ 0.7552 | $ 0.35 | $ 1.10520 |
Reports
- Budget and Finance Presentation – 2025
- Budget and Finance Presentation – 2024
- Budget and Finance Presentation – 2023
- Budget and Finance Presentation – 2022
- Budget and Finance Presentation – 2021
- Budget and Finance Presentation – 2020
- Budget and Finance Presentation – 2019
- Budget and Finance Presentation – 2018
- Budget and Finance Presentation – 2017
Official Budget (PDF documents)
- 2025-2026 Official Budget
- 2024-2025 Official Budget
- 2023-2024 Official Budget
- 2022-2023 Official Budget
- 2021-2022 Official Budget
- 2020-2021 Official Budget
- 2019-2020 Official Budget
- 2018-2019 Official Budget
- 2017-2018 Official Budget
Adopted Budget (Microsoft Excel spreadsheets)
Debt Transparency Pledge
Detail of Principal and Interest Payments
Independent Registered Municipal Advisor Rule Certificate
Annual Debt Disclosure Required by House Bill 1387 (84R)
Debt Outstanding As of February 16, 2025
RISD Bond Ratings:
Standard & Poor’s Corporation: AA+
Moody’s Investors Service: Aaa
Tax Rate Calculations Worksheet
Current Tax Rates
- M&O: $0.75520 per $100 valuation
- Debt Service: $0.35000 per valuation
- Total: $1.10520 per $100 valuation
By fiscal year. RISD’s fiscal year is July 1 to June 30.
Some documents may contain content that is not accessible to all readers. To obtain assistance accessing these documents, please contact RISD’s Budget Office at 469-593-0331.